Ever notice the sponsored link just above the natural search results? It’s a great position for Pay Per Click Ads, as they convert higher than Ads shown on the right side of the page. You can only get that spot by bidding much higher than the #2 bidder…so you risk a pretty high Cost Per Click (CPC) when doing so, unless you know how to offset that risk.
One metric many SEO gurus use before attempting to bid for that spot is to make sure that you have a really low CPC. Unfortunately, they also assume a low CPC means you aren’t paying 8 – 10 times MORE than that…right? Wrong.
One of my clients has a CPC average of $.68 and we bid very high in order to have the best chance of getting the coveted “Sponsored Link” above the natural results. Most of the time, we thought we were getting similar low CPC, as our average didn’t change much. (Simple example: We bid $10 to get the Sponsor Link, and the next closest bid is $1. Our CPC will be a little more than $1 but we grab the Sponsor Link and get much more traffic).
You really need to understand how this works as well as monitoring your costs very carefully if you’re going to implement this PPC marketing strategy…because you could easily be paying 8 – 10 times more for some clicks than your average, maybe even higher. Because, if you are bidding $10 and your Average CPC is $1, your real CPC cost could be $0.1 for some clicks and $9 for other ones.
AND…the clicks that cost $9 are not necessarily the ones that convert to real sales.
This may come as a surprise to even many SEO experts, but Google doesn’t make it easy to view the cost of individual clicks. Google only easily shows Average CPC.
However, you can use Google Analytics to help uncover a good bit of the real costs, even though this method isn’t perfect.
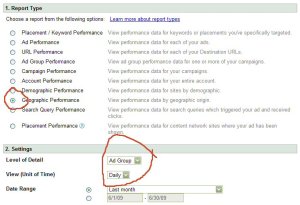
First, you’ll need to use the reports tab and select “Geographical Performance”. This is a quick and dirty way to try to display the most detail about individual clicks as possible. In many cases, you’ll seeing the price of a single click in various countries if you set it up for daily and regional as shown here:
By doing this every click will be separated by ‘AdGroup’, then ‘Day’ and finally, ‘Region’. And there can be hundreds of regions in a single country, making it possible to see the cost of many single clicks. Even group clicks are significantly reduced, so you have a better CPC average cost at that level.
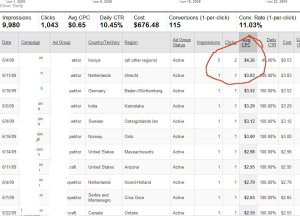
While you may want to export this data into a spreadsheet and analyze or sort columns by more than one criteria, you’ll also see that by merely clicking on the CPC label at the top of the report, you can quickly see how high your actual Cost Per Click might be:
Keep in mind that the Average CPC of the above real account is $.65, but in this case we have paid over $4 for clicks in some countries that really don’t convert very well for this client.
Based on analyzing these reports, we decided we should take action. Even though this client already had separate campaigns for US, UK/Europe, Australia and RestOfWorld to achieve higher position for less cost, we decided we should split them up even further.
We grouped low converting countries into their own campaigns and lowered our bid max for that group.
We maintain high bidding on the good converting campaigns to still be assigned the coveted Sponsor Link where our CPC is truely low. We lowered bids in areas where the reports showed an actual high CPC and convert into sales less frequently.

